Displaying Page Load Metrics on Your Site

José M. Pérez / March 30, 2018
5 min read • 1,414 views
I was browsing and I noticed he had added page load time metrics in the footer.

Tim Kadlec's site shows how long the page took to load in the footer.
Stoyan Stefanov also realized and wrote , a blog post describing the code used for this. Stoyan also created a bookmark that shows an alert with the load time of the current page. The data is obtained from .
I liked the idea and added a similar snippet that shows the page load time in the footer (you should see it if you scroll to the bottom). If your browser supports the you will see a couple of extra metrics: First Paint and First Contentful Paint.
First Paint and First Contentful Paint
Page load time is a metric that tells us part of the story. Yet it might not reflect how fast the visible area loads. For instance, a page with lots of images will report a large page load time, since the load event will be triggered when all of them are fetched, even though the above-the-fold content might load way earlier. It is still a good idea, since it forces us to think about lazy-loading the resources when needed.
I have written before about and metrics that tell how long it takes to render something on the page. Using the Paint Timing API we can get the .
My code snippet extends Tim's and Stoyan's to report these metrics, obtained running performance.getEntriesByType('paint'):
window.addEventListener('load', () => {
  setTimeout(() => {
    const t = window.performance && performance.timing;
    const round2 = num => Math.round(num * 100) / 100;
    if (t) {
      const timingStats = document.querySelector('.timing-stats');
      const loadTime = (t.loadEventEnd - t.navigationStart) / 1000;
      let timingStatsHTML = `This page loaded in ${round2(loadTime)} seconds. `;
      const perfEntries = performance.getEntriesByType('paint');
      perfEntries.forEach((perfEntry, i, entries) => {
        timingStatsHTML += `${perfEntry.name} was ${round2(
          perfEntry.startTime / 1000
        )} seconds. `;
      });
      timingStats.innerHTML = timingStatsHTML;
    }
  }, 0);
});
In the future I would like to extend the reported metrics to include (whenever it is implemented, see ) and (using ).

Slide from showing different key moments during a page load.
has been working on , a library to measure these metrics, annotate them to the dev tools timeline and optionally reporting them to Google Analytics. It also has a fallback for browsers that do not support the Paint Timing API.
You can read more about the library on his posts " and "".
If you are into this topic, I also recommend you to watch the talk .
How to Calculate the Transfer Size
The Resource Timing API allows to . For CORS requests is necessary to set up properly to return the transfer size. Otherwise they will report 0 as the transfer size.
Another caveat is that there doesn't seem to be a way to know the transfer size of the page itself. One could calculate the length of the document's innerHTML, but that won't match the transfer size if the response was compressed (which hopefully was).
Let's have a look at an example:
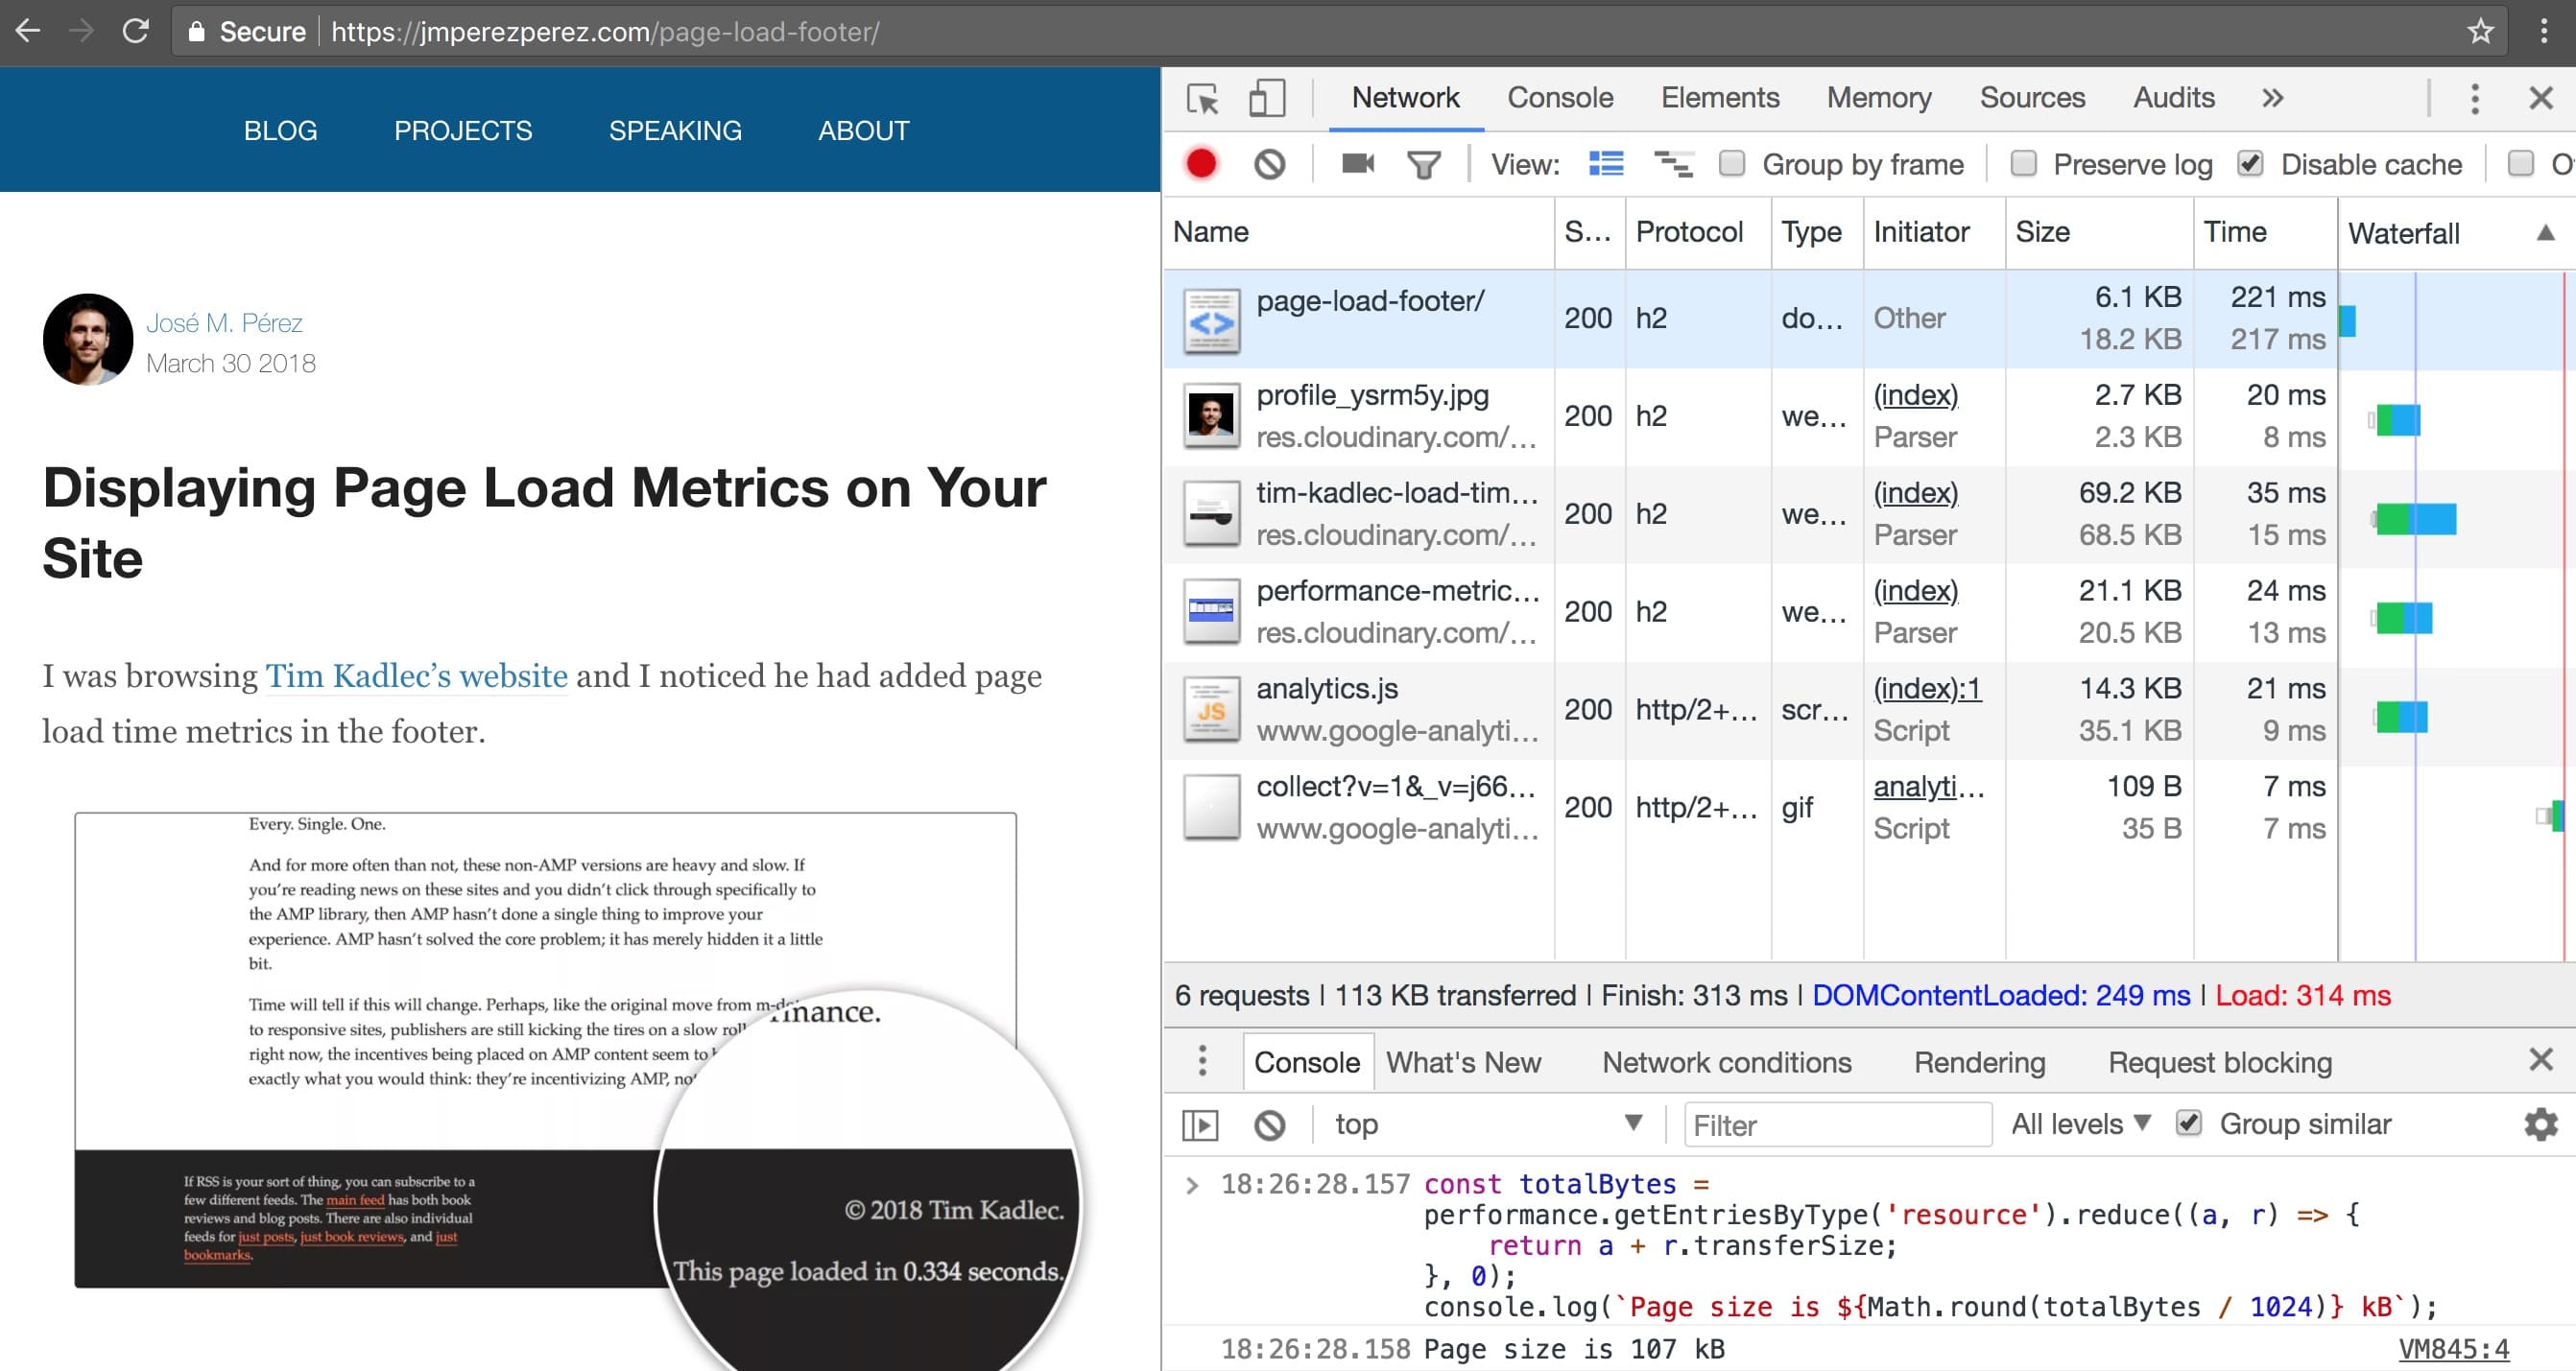
Calculating the transferred size of the request susing Resource Timing API.
The page that I'm loading, served from jmperezperez.com, makes requests to fetch assets from res.cloudinary.com and , which are external domains. Once loaded, I run this code to calculate the transferred size:
const totalBytes = performance.getEntriesByType('resource').reduce((a, r) => {
  return a + r.transferSize;
}, 0);
console.log(`Page size is ${Math.round(totalBytes / 1024)} kB`);
The reported transferred size according to the dev tools is 113 kB, while the calculated using the code above (Resource Timing API) is 107 kB. Both res.cloudinary.com and set the timing-allow-origin: * response header, which let us get the right transferSize.
You can read more about Cloudinary's usage of Server Timing on their recent post “”.
Although we can't get the exact page load size, using these APIs get us way closer.
Reporting Metrics Inline and RUM
These new browser APIs allow us to access metrics from JavaScript, which previously could only be accessed manually using the developer tools. Access from the browser means we can show them to the user or report them to a Real User Monitoring solution to track and optimize user's experience.
Displaying these metrics on our sites is a way to communicate publicly that we are taking performance seriously.