PerformanceObserver and Paint Timing API
José M. Pérez / June 17, 2017
4 min read • 1,933 views
In a recent post about Chrome 60 Beta, Google announced the support of the Paint Timing API to get metrics on when your page starts rendering and when the user gets content that can be consumed (more info on the definition of the events below). Here I'm going to describe this new API a bit and show you how to use it.

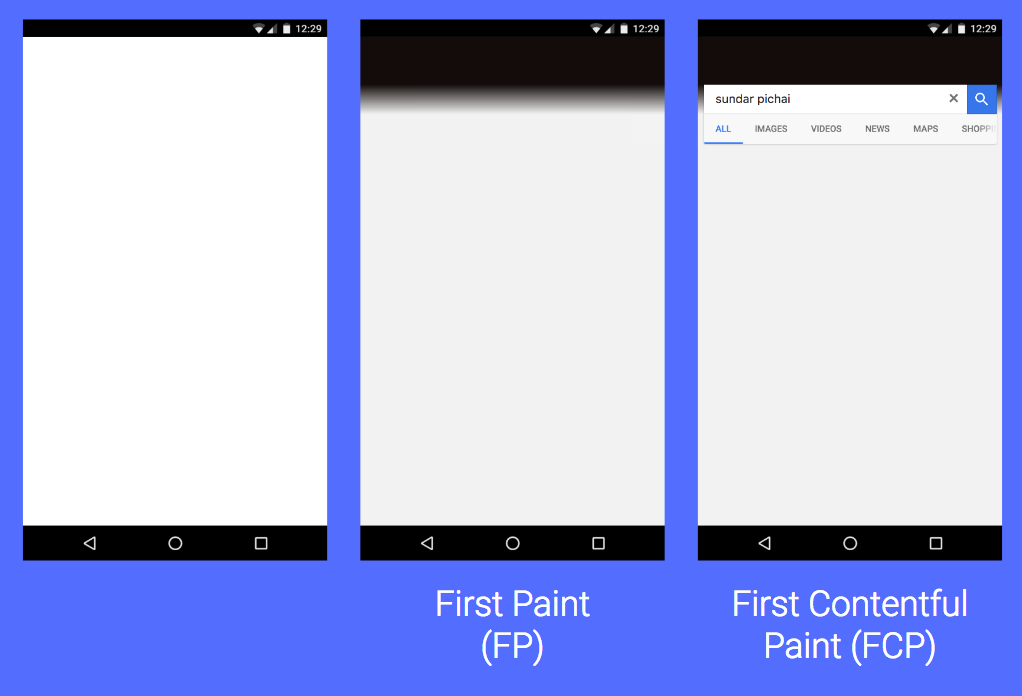
Image taken from the Chrome 60 blog post, which first appeared in "Web Performance: Leveraging the Metrics that Most Affect User Experience" at Google I/O 2017
Up until now we have been measuring performance through other metrics, mostly using the Navigation Timing API, which is also what Google Analytics uses for their Site Speed report. Yet those metrics don't tell us the whole picture about the rendering experience.
The Paint Timing API aims to improve this by exposing metrics on paint events that are grouped in two types of entries. By its definition:
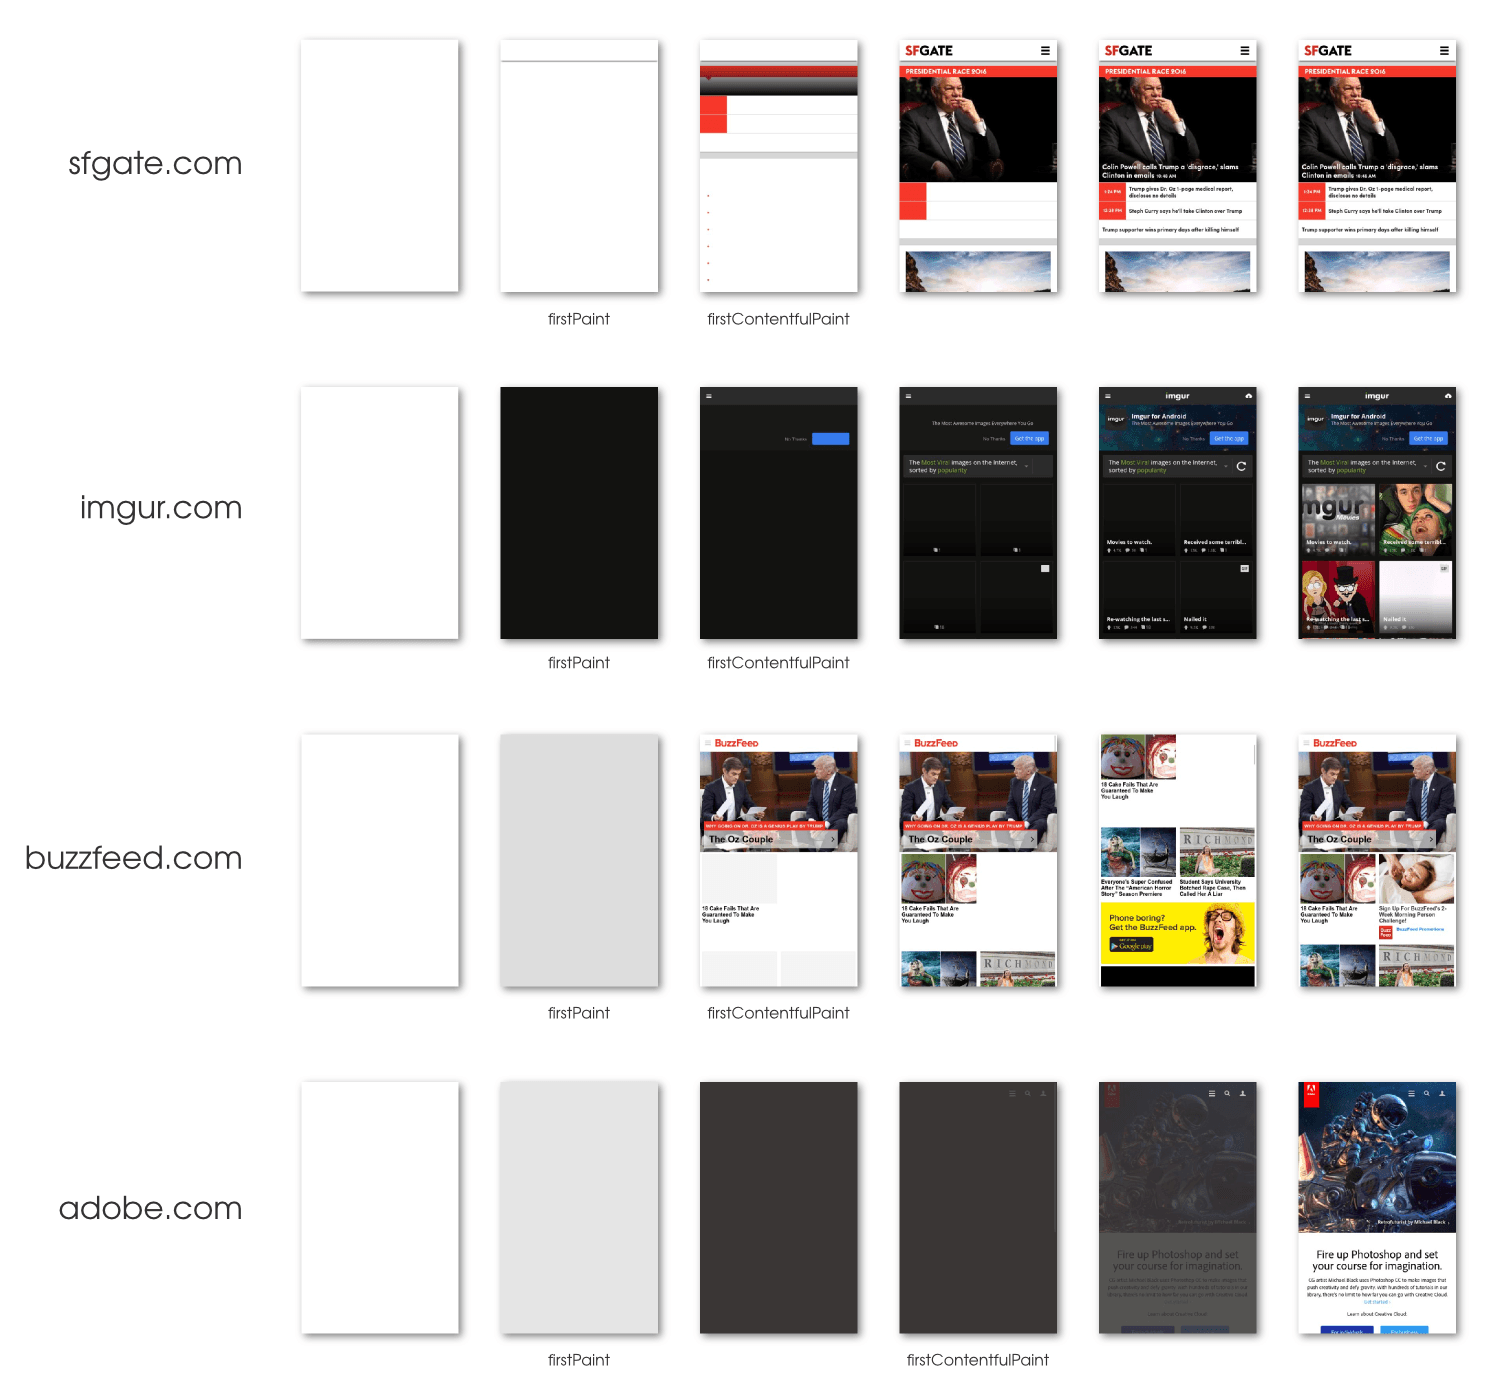
"first-paint"entries contain aDOMHighResTimeStampreporting the time when the browser first rendered after navigation. This excludes the default background paint, but includes non-default background paint. This is the first key moment developers care about in page load - when the browser has started to render the page."first-contentful-paint"contain aDOMHighResTimestampreporting the time when the browser first rendered any text, image (including background images), non-white canvas or SVG. This includes text with pending webfonts. This is the first time users could start consuming page content.
A picture is worth a thousand words, so let's see how these entries would be reported by some real web sites:

Image taken from the Paint timing API repo on WICG.
Hacking on it
As a hack project I decided to give it a try and implement it on a web site. You have a basic example on the Paint timing page:
var observer = new PerformanceObserver(function(list) {
  var perfEntries = list.getEntries();
  for (var i = 0; i < perfEntries.length; i++) {
     // Process entries
     // report back for analytics and monitoring
     // ...
  }
});

// register observer for long task notifications
observer.observe({entryTypes: ["paint"]});
In practice you will probably want to report the information somewhere you can track it. If you are using Google Analytics, you can use this snippet from Google's Developer site (ES6):
const observer = new PerformanceObserver((list) => {
  for (const entry of list.getEntries()) {
    // `name` will be either 'first-paint' or 'first-contentful-paint'.
    const metricName = entry.name;
    const time = Math.round(entry.startTime + entry.duration);

    ga('send', 'event', {
      eventCategory: 'Performance Metrics',
      eventAction: metricName,
      eventValue: time,
      nonInteraction: true,
    });
  }
});

// Start observing paint entries.
observer.observe({entryTypes: ['paint']});
Word of Caution
The API is still experimental and in “Editor's Draft” state. Also, the fact that a browser supports PerformanceObserver doesn't mean that it supports the Paint events.
In the quick test I run, the above snippet would throw an exception:
Uncaught TypeError: Failed to execute 'observe' on
'PerformanceObserver': A Performance Observer MUST
have at least one valid entryType in its entryTypes
attribute.
It turns out that if you only observe the paint entryType and this is not supported in the browser, it will throw an exception. According to the specification:
entryTypes: A list of entry names to be observed. The list must not be empty and types not recognized by the user agent must be ignored.
In short, if you are giving this API a try, make sure you try...catch the observer.observe() call.
Conclusions
This is a bit in early stages but I'm looking forward to see how the API evolves and we can use it to track Web Performance even better. This will also be a great addition to LightHouse, WebPageTest, Calibre and the rest of tools we use to monitor metrics on our sites.